InfluxDB Alerting in an Event-Driven Architecture: Walkthrough and considerations
This article documents an implementation of automated alerting for time-series data in an event-driven architecture. We'll walk through building a system that monitors data ingestion from 2000+ IoT devices and automatically creates, enables, and disables alerts based on device lifecycle events.
What we're solving:
- Automated alert management for thousands of measurement streams
- Decoupling alerting logic from configuration databases
- Ensuring consistency between database state and alert state using the transactional outbox pattern
Technologies covered:
- InfluxDB v1 & Kapacitor for time-series storage and alerting
- Debezium & Kafka Connect for change data capture
- Benthos for stream processing and orchestration
- Kubernetes/OpenShift for deployment
Problem Statement
In a project where numerous time series from IoT devices are stored, the following architecture is in place:
- A Kafka broker that holds the measurements obtained from the IoT devices.
- A simple sink connector that writes the measurements to the InfluxDB database for historical storage.
- A legacy backend service for process configuration, which uses MySQL for saving configurations.

To ensure that the measurements are being stored in the time series database, we want to create an alerting mechanism that can notify the user if data from an "active" IoT device stops arriving at the database.
Attempted Solution: Native InfluxDB Deadman Checks
The first solution we investigated uses the native checks in InfluxDB version 1, as demonstrated in this article: How to Use a Deadman Check to Alert on Service Outage.
The article illustrates the creation of these checks for InfluxDB version 2, and the process for version 1 is similar.
Why This Didn't Work
The outlined solution has a significant limitation, at least for InfluxDB version 1:
The Deadman check can be created for a single measurement only.
It is not possible to create a single Deadman check that spans multiple measurements, even if they reside in the same database.
The scale problem: In our case, each IoT device is associated with a specific measurement, which means we would need to:
- Manually create approximately 2000 Deadman checks
- Manually activate and deactivate checks when operators turn devices on or off
- Maintain consistency between device state in MySQL and alert state in Kapacitor
This manual approach doesn't scale and is error-prone.
Note on data modeling: It's possible that a different data layout, as discussed in Data Layout and Schema Design Best Practices for InfluxDB, could have avoided this issue (e.g., using tags instead of separate measurements). However, this was a legacy system constraint we couldn't change.
Solution: Event-Driven Alerting Architecture
The second solution aims to create an automated, decoupled alerting system that addresses the limitations of manual alert management.
Design Principles
Our solution follows these key principles:
- Event-Driven: All state changes flow through Kafka as events, ensuring auditability and loose coupling
- Technology Agnostic: The event schema is independent of InfluxDB, making it easier to migrate to other time-series databases
- Consistency Guarantees: Using the transactional outbox pattern ensures database writes and event publishing happen atomically
- Automated Lifecycle Management: Alerts are automatically created, enabled, and disabled based on device state changes
Architecture Components
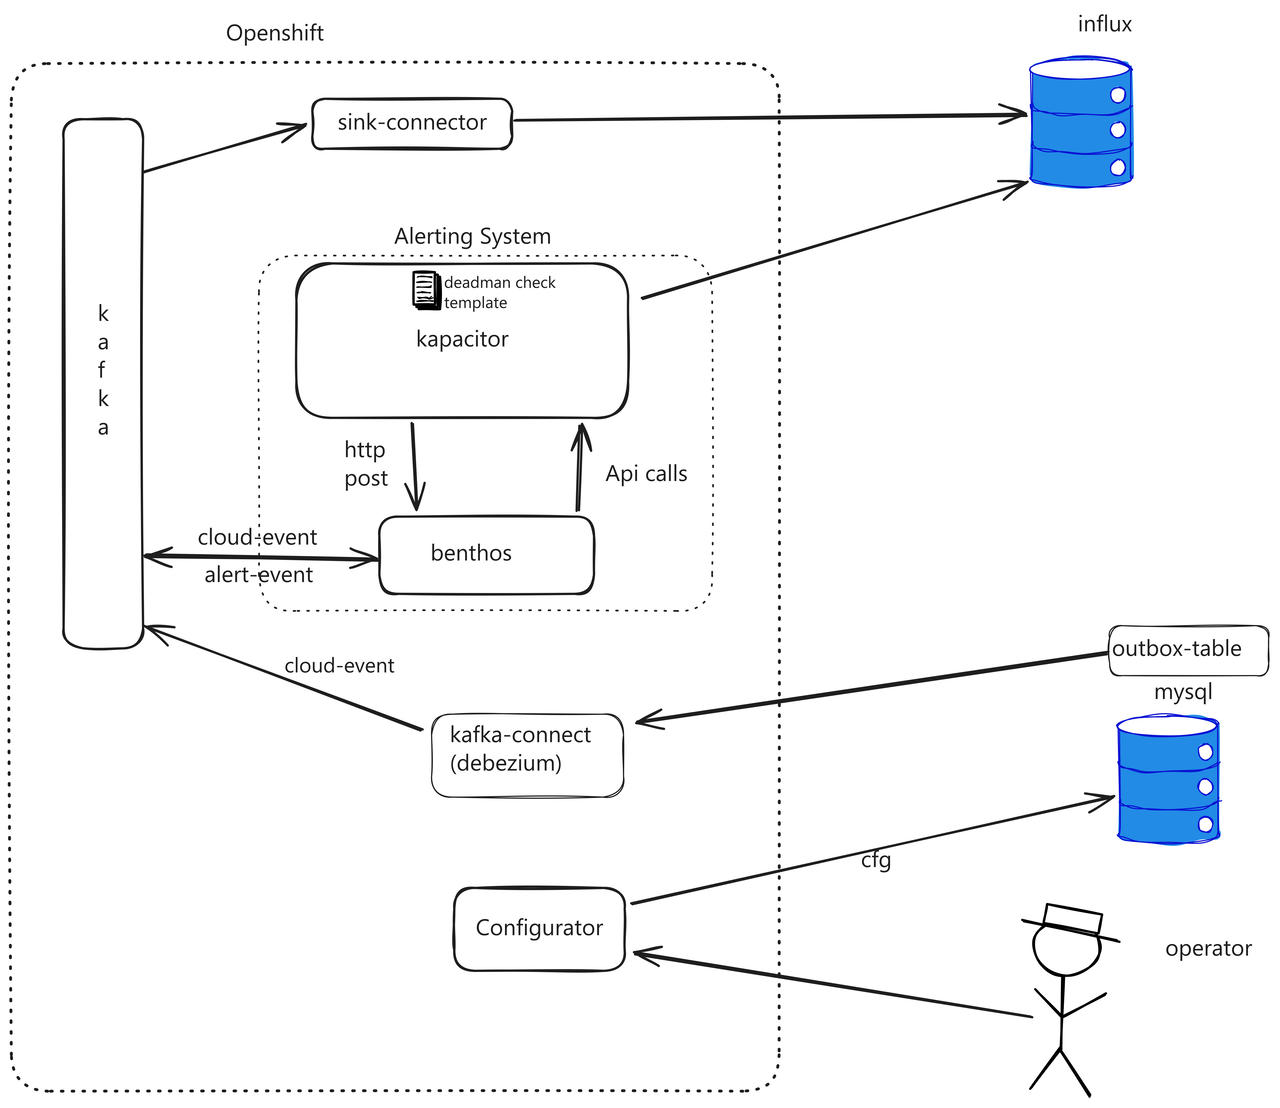
Component breakdown:
- MySQL + Outbox Table: Configuration database with an outbox table for transactional event publishing
- Debezium (Kafka Connect): Captures changes from the outbox table and publishes Cloud Events to Kafka
- Kafka: Event backbone carrying both IoT measurements and device lifecycle events
- Benthos: Stream processor that translates lifecycle events into Kapacitor API calls and converts alerts back to events
- Kapacitor: InfluxDB's native alerting engine that monitors measurements and triggers deadman alerts
- InfluxDB: Time-series database storing IoT measurements
Data Flow
Here's what happens when an operator enables a device:
1. Operator action → Configurator service updates MySQL + Outbox table (single transaction)
2. Debezium detects outbox change → Publishes Cloud Event to Kafka
3. Benthos consumes event → Translates to Kapacitor API call
4. Kapacitor creates/enables alert → Monitors InfluxDB for device measurements
5. [Time passes, no data arrives]
6. Kapacitor triggers deadman alert → POSTs to Benthos
7. Benthos receives alert → Publishes alert event to Kafka
8. Downstream consumers react → Notify operators, update dashboards, etc.
Key Architectural Decisions
Why Debezium + Outbox Pattern?
The transactional outbox pattern solves the "dual write problem" - ensuring that database changes and event publishing happen atomically.
Why this matters: Without the outbox pattern, the configurator service would need to:
- Write to MySQL
- Publish to Kafka
If step 2 fails, Kafka consumers won't see the change even though MySQL was updated. If step 1 fails but step 2 succeeds, Kafka has an event for a change that never happened in the database.
The solution: Write both the configuration change AND an event record to an "outbox" table within a single database transaction. Then, Debezium reads from the outbox table and reliably publishes to Kafka. This guarantees that:
- Events are only published if the database write succeeds
- No events are lost if Kafka is temporarily unavailable
- Event ordering is preserved
Why Benthos?
Benthos (now Redpanda Connect) acts as our integration layer because it:
- Provides declarative stream processing with Bloblang (its query language)
- Handles HTTP API integration natively
- Supports complex routing and error handling (DLQ)
- Requires no custom code - everything is configuration
Why Kapacitor?
Kapacitor is InfluxDB's native alerting engine with:
- Built-in deadman checks for detecting stopped data streams
- Template support for creating similar alerts at scale
- Direct integration with InfluxDB subscriptions
Implementation
Now let's walk through implementing each component.
Step 1: Create the Outbox Table
The first step is creating the Outbox table in MySQL. Follow the guidance in Reliable Microservices Data Exchange With the Outbox Pattern.
CREATE TABLE `outbox` (
  `id` bigint NOT NULL AUTO_INCREMENT,
  `payload` json DEFAULT NULL,
  `type` varchar(255) CHARACTER SET utf8mb4 COLLATE utf8mb4_0900_ai_ci NOT NULL,
  `aggregateid` char(36) NOT NULL,
  `aggregatetype` varchar(100) DEFAULT NULL,
  PRIMARY KEY (`id`),
  UNIQUE KEY `aggregateid` (`aggregateid`)
) ENGINE=InnoDB AUTO_INCREMENT=257 DEFAULT CHARSET=utf8mb4 COLLATE=utf8mb4_0900_ai_ci;
Important: Modify your configurator process to write to the outbox table within the same transaction as the configuration change:
START TRANSACTION;
  -- Update device configuration
  UPDATE devices SET status = 'enabled' WHERE id = ?;

  -- Write event to outbox
  INSERT INTO outbox (payload, type, aggregateid, aggregatetype)
  VALUES (?, 'device-enabled', ?, 'device');
COMMIT;
Step 2: Configure Kafka Connect (Debezium)
We need to configure Kafka Connect on AMQ Streams (OpenShift). This requires three steps:
- Build a Docker Image with necessary plugins (for airgapped environments)
- Deploy a Connect Cluster
- Configure the Source Connector
2a. Build Custom Docker Image
In our airgapped environment, we need all dependencies pre-installed:
FROM registry.redhat.io/amq7/amq-streams-kafka-31-rhel8:2.1.0
USER root:root
RUN set -ex && \
    mkdir -p /opt/kafka/plugins && \
    cd /opt/kafka/plugins && \
    # Download Debezium MySQL connector
    curl https://maven.repository.redhat.com/ga/io/debezium/debezium-connector-mysql/2.7.3.Final-redhat-00003/debezium-connector-mysql-2.7.3.Final-redhat-00003-plugin.zip -O && \
    unzip debezium-connector-mysql-2.7.3.Final-redhat-00003-plugin.zip && \
    # Download Debezium scripting support
    curl https://maven.repository.redhat.com/ga/io/debezium/debezium-scripting/2.7.3.Final-redhat-00003/debezium-scripting-2.7.3.Final-redhat-00003.zip -O && \
    unzip debezium-scripting-2.7.3.Final-redhat-00003.zip && \
    # Download Groovy dependencies (needed for SMT transformations)
    curl https://repo1.maven.org/maven2/org/apache/groovy/groovy/4.0.24/groovy-4.0.24.jar -O && \
    curl https://repo1.maven.org/maven2/org/apache/groovy/groovy-jsr223/4.0.24/groovy-jsr223-4.0.24.jar -O && \
    curl https://repo1.maven.org/maven2/org/apache/groovy/groovy-json/4.0.24/groovy-json-4.0.24.jar -O && \
    # Cleanup
    rm debezium-connector-mysql-2.7.3.Final-redhat-00003-plugin.zip debezium-scripting-2.7.3.Final-redhat-00003.zip
USER 1001
All those dependencies are necessary for Debezium to work. More details: Debezium User Guide and Debezium OpenShift
2b. Deploy Kafka Connect Cluster
apiVersion: kafka.strimzi.io/v1beta2
kind: KafkaConnect
metadata:
  annotations:
    strimzi.io/use-connector-resources: 'true'  # Enable KafkaConnector CRD
  name: connect-cluster
  namespace: <redacted>
spec:
  bootstrapServers: 'central-cluster-kafka-bootstrap.<redacted>.svc.cluster.local:9092'
  config:
    # Internal topics for Connect cluster state
    config.storage.replication.factor: -1
    config.storage.topic: connect-cluster-configs
    group.id: connect-cluster
    offset.storage.replication.factor: -1
    offset.storage.topic: connect-cluster-offsets
    status.storage.replication.factor: -1
    status.storage.topic: connect-cluster-status
  image: <your-custom-image-from-step-2a>
  replicas: 1
  version: 3.1.0
2c. Configure MySQL Source Connector
apiVersion: kafka.strimzi.io/v1beta2
kind: KafkaConnector
metadata:
  labels:
    strimzi.io/cluster: connect-cluster
  name: mysql-source-connector
  namespace: <redacted>
spec:
  class: io.debezium.connector.mysql.MySqlConnector
  config:
    # MySQL connection
    database.hostname: 192.168.6.38
    database.port: 3306
    database.user: <redacted>
    database.password: <redacted>
    database.server.id: 184051
    database.include.list: <db name redacted>

    # Only watch the outbox table
    table.include.list: <db name redacted>.outbox

    # Topic naming
    topic.prefix: connector-mysql

    # Transform outbox records into Cloud Events
    transforms: 'addMetadataHeaders,outbox'

    # Outbox Event Router - converts outbox table to proper events
    transforms.outbox.type: io.debezium.transforms.outbox.EventRouter
    transforms.outbox.table.fields.additional.placement: 'type:header'
    transforms.outbox.table.expand.json.payload: 'true'

    # Add metadata headers for monitoring
    transforms.addMetadataHeaders.type: org.apache.kafka.connect.transforms.HeaderFrom$Value
    transforms.addMetadataHeaders.operation: copy
    transforms.addMetadataHeaders.fields: 'source,op,transaction'
    transforms.addMetadataHeaders.headers: 'source,op,transaction'
    transforms.addMetadataHeaders.negate: 'true'
    transforms.addMetadataHeaders.predicate: isHeartbeat

    # Heartbeat predicate
    predicates: isHeartbeat
    predicates.isHeartbeat.type: org.apache.kafka.connect.transforms.predicates.TopicNameMatches
    predicates.isHeartbeat.pattern: __debezium-heartbeat.*

    # Cloud Events format
    value.converter: io.debezium.converters.CloudEventsConverter
    value.converter.metadata.source: 'header,id:generate,type:header,dataSchemaName:header'
    value.converter.json.schemas.enable: 'false'

    # Headers
    header.converter: org.apache.kafka.connect.json.JsonConverter
    header.converter.schemas.enable: 'true'

    # Don't create tombstones on delete
    tombstones.on.delete: 'false'

    # Schema history (required for MySQL connector)
    schema.history.internal.kafka.topic: schema-changes.<db name redacted>
    schema.history.internal.kafka.bootstrap.servers: 'central-cluster-kafka-bootstrap.<redacted>.svc.cluster.local:9092'
    schema.data.name.source.header.enable: true
What this connector does:
- Watches the
outboxtable for INSERT operations - Extracts the event from the outbox record
- Converts it to CloudEvents format
- Publishes to Kafka topics based on the
aggregatetypefield
Step 3: Deploy Alerting System (Benthos + Kapacitor)
We created a Helm chart that orchestrates both Benthos and Kapacitor deployment.
Chart Dependencies
dependencies:
  - name: kapacitor
    version: "1.4.7"
    condition: kapacitor.enabled
    repository: "https://helm.influxdata.com/"
  - name: benthos
    version: "2.2.0"
    condition: benthos.enabled
    repository: https://benthosdev.github.io/charts/
The chart needs to:
- Install the template for alert creation using a job
- Create the ingress for communication with the InfluxDB instance outside of OpenShift
- Create the secret with user credentials
Kapacitor Template
This is the template for creating deadman alerts (more here: template docs):
// Template VARS - these are parameterized and provided when creating a task from this template
var name  string // unique identifier for this alert task
var db string // InfluxDB database name to query
var rp string // retention policy to use (e.g., 'autogen')
var measurement string // the specific measurement to monitor (maps to device ID)

// Variables with default values - can be overridden when creating tasks
var groupBy = []  // tags to group by (empty = treat as single series)
var whereFilter = lambda: ("ty" == 'F')  // filter condition - only check 'F' type records
var period = 1m  // how often to check for data (1 minute window)
var message = ' id:{{.ID}} name:{{.Name}} taskname:{{.TaskName}} group:{{.Group}} tags:{{.Tags}} level:{{.Level}} fields:{{.Fields}} time:{{.Time}}  '
var outputDB = 'chronograf'  // where to store alert states
var outputRP = 'autogen'
var outputMeasurement = 'alerts'  // measurement name for alert records
var threshold = 0.0  // deadman threshold - triggers if no points received
var triggerType = 'deadman'
var idVar = name  // use the task name as the alert ID
var idTag = 'alertID'  // tag name for alert ID in output
var levelTag = 'level'  // tag name for alert level (OK, CRITICAL)
var messageField = 'message'  // field name for alert message
var durationField = 'duration'  // field name for alert duration
var query = 'SELECT * FROM "' + db + '"."' + rp + '"."' + measurement + '" WHERE "ty" = \'F\''

// Alert definition - batch query approach
var data = batch
    |query(query)  // execute the query against InfluxDB
        .period(period)  // check every 'period' interval
        .every(period)   // execute query every 'period'
        .groupBy(groupBy)  // group results by specified tags

// Deadman trigger - fires when no data points received within period
var trigger = data
    |deadman(threshold, period)  // trigger if points <= threshold in period
        .message(message)
        .id(idVar)  // unique identifier for this alert
        .idTag(idTag)
        .levelTag(levelTag)
        .messageField(messageField)
        .durationField(durationField)
        .stateChangesOnly()  // only trigger when state changes (OK ↔ CRITICAL)

// Output 1: Store alert states in InfluxDB for querying/dashboards
trigger
    |eval(lambda: "emitted")  // add 'emitted' field with static value
        .as('value')
        .keep('value', messageField, durationField)
    |eval(lambda: float("value"))  // convert to float for InfluxDB
        .as('value')
        .keep()
    |influxDBOut()
        .create()
        .database(outputDB)
        .retentionPolicy(outputRP)
        .measurement(outputMeasurement)
        .tag('alertName', name)  // add alert metadata as tags
        .tag('triggerType', triggerType)

// Output 2: Expose via HTTP endpoint for external monitoring
trigger
    |httpOut('output')  // make alert data available at /kapacitor/v1/tasks/:task_id/output

// Output 3: POST alert to Benthos for event generation
trigger
    .post('output')  // when alert fires, POST to named endpoint
    .endpoint('benthos')  // configured in Kapacitor envVars as KAPACITOR_HTTPPOST_0_URL
Template Installation Job
The template is installed via a Kubernetes Job that runs after Helm install/upgrade:
apiVersion: batch/v1
kind: Job
metadata:
  name: {{ include "alerting-system.fullname" . }}-templates-installer
  labels:
    {{- include "alerting-system.labels" . | nindent 4 }}
  annotations:
    "helm.sh/hook": post-install,post-upgrade
    "helm.sh/hook-delete-policy": hook-succeeded
spec:
  template:
    spec:
      containers:
      - name: curl
        image: "{{ .Values.templateInstallJob.image.repository }}:{{ .Values.templateInstallJob.image.tag | default "latest" }}"
        command: ["sh", "-c"]
        args:
          - |
            set -ex
            base_url='http://{{ template "kapacitor.fullname" .Subcharts.kapacitor }}:9092/kapacitor/v1/templates'
            script=`cat /config/measurement_series_not_fed_template`

            # Wait for Kapacitor to be ready
            sleep 10

            # Check if template exists
            response_code=$(curl -s -o /dev/null -w "%{http_code}" "$base_url/measurement_series_not_fed_template")

            if [ "$response_code" -eq 404 ]; then
              # Create new template
              curl --fail -X POST \
                -H "Content-Type: application/json" \
                --data-raw "{\"id\":\"measurement_series_not_fed_template\",\"type\":\"batch\",\"script\":\"$script\"}" \
                "$base_url"
            elif [ "$response_code" -eq 200 ]; then
              # Update existing template
              curl --fail -X PATCH \
                -H "Content-Type: application/json" \
                --data-raw "{\"id\":\"measurement_series_not_fed_template\",\"type\":\"batch\",\"script\":\"$script\"}" \
                "$base_url/measurement_series_not_fed_template"
            else
              echo "Unexpected response code: $response_code"
              exit 1
            fi
        volumeMounts:
        - name: config-volume
          mountPath: /config
      volumes:
      - name: config-volume
        configMap:
          name: {{ include "alerting-system.fullname" . }}
      restartPolicy: Never
  backoffLimit: 10
Benthos and Kapacitor Configuration
This is the value for configuring Benthos and Kapacitor in our environment:
templateInstallJob:
  image:
    repository: curlimages/curl
    pullPolicy: IfNotPresent
    tag: "8.11.0"

ingress:
  enabled: true
  className: ""
  annotations: {}
  hosts:
    - host: kapacitor.apps.ocp1.<redacted>
      paths:
        - path: /
          pathType: ImplementationSpecific
  tls: []

kapacitor:
  enabled: true

  image:
    repository: "kapacitor"
    tag: "1.7.6-alpine"
    pullPolicy: "IfNotPresent"

  service:
    type: ClusterIP

  persistence:
    enabled: true
    accessMode: ReadWriteOnce
    size: 8Gi

  resources:
    requests:
      memory: 256Mi
      cpu: 0.1
    limits:
      memory: 1Gi

  envVars:
    KAPACITOR_HTTP_LOG_ENABLED: false
    KAPACITOR_LOGGING_LEVEL: "ERROR"
    KAPACITOR_INFLUXDB_0_HTTP_PORT: "80"
    # This allows external InfluxDB to connect to Kapacitor via Ingress
    KAPACITOR_INFLUXDB_0_KAPACITOR_HOSTNAME: "kapacitor.apps.ocp1.<redacted>"
    KAPACITOR_HTTPPOST_0_ENDPOINT: "benthos"
    KAPACITOR_HTTPPOST_0_URL: "http://benthos-internal-service/post"

  influxURL: http://192.168.6.39:8086

  # Reference to secret containing influxdb-user and influxdb-password
  existingSecret: influx-auth

  affinity: {}
  tolerations: []

  rbac:
    create: true
    namespaced: true

  serviceAccount:
    annotations: {}
    create: true
    name:

  namespaceOverride: ""

benthos:
  enabled: true

  deployment:
    replicaCount: 1

  image:
    repository: "docker.io/jeffail/benthos"

  resources:
    limits:
      cpu: 200m
      memory: 128Mi
    requests:
      cpu: 200m
      memory: 128Mi

  autoscaling:
    enabled: false

  serviceMonitor:
    enabled: true

  metrics:
    prometheus: {}

  logger:
    level: INFO
    static_fields:
      '@service': benthos

  config: |
    input:
      broker:
        inputs:
          - kafka:
              addresses:
                - "central-cluster-kafka-bootstrap.<redacted>.svc.cluster.local:9092"
              topics: ["<redacted>"]
              consumer_group: "kapacitor-alerts-connector"
              start_from_oldest: true

          - http_server:
              path: /post
              ws_path: /post/ws
              allowed_verbs:
                - POST
              timeout: 10s

    pipeline:
      processors:
        - bloblang: 'meta original_message = this'
        - log:
            level: DEBUG
            message: "Received message: ${!json()}"

        - try:
          - group_by:
            - check: this.exists("message")
              processors:
                - mapping: 'meta grouping = "historicization-event"'
                - type: log
                  log:
                    level: INFO
                    message: |
                      Received http post from kapacitor with id: ${!json("id")}, time: ${!json("time")} and level: ${!json("level")}
                - bloblang: |
                    root = {
                      "id": uuid_v4(),
                      "subject": this.id.trim_suffix("_not_fed"),
                      "source": "benthos",
                      "specversion": "1.0",
                      "time": this.time,
                      "type": if this.level == "OK" {
                        "historicization-restarted"
                      } else if this.level == "CRITICAL" {
                        "historicization-stopped"
                      }
                    }
                - log:
                    level: INFO
                    message: "Sending cloudevent message to kafka ${!json()}"


            - check: this.exists("type")
              processors:
                - mapping: 'meta grouping = "input-stream-event"'
                - type: log
                  log:
                    level: INFO
                    message: |
                      Received cloud event with id: ${!json("id")} and type: ${!json("type")}
                - bloblang: |
                    root = this.data.devicescode
                - unarchive:
                    format: json_array
                - bloblang: |
                    let parsed = meta("original_message").parse_json()
                    root = {
                      "devicecode": this,
                      "eventtype": $parsed.data.eventtype,
                    }
                - switch:
                  - check: this.eventtype == "disabled"
                    processors:
                      - bloblang: |
                          meta type = "disabled"
                          meta id = this.devicecode + "_not_fed"
                          root = {
                            "status": "disabled"
                          }
                  - check: this.eventtype == "enabled"
                    processors:
                      - try:
                        - bloblang: |
                            meta type = "enabled"
                            meta id = this.devicecode + "_not_fed"
                            root = this
                        - http:
                            url: http://{{ template "alerting-system.kapacitorFullname" . }}:9092/kapacitor/v1/tasks/${!meta("id")}
                            verb: GET
                            retries: 1
                        - bloblang: |
                            root = {
                              "status": "enabled"
                            }
                      - catch:
                        - log:
                            level: WARN
                            message: "Task ${!meta("id")} not found. Fallback to created"
                        - bloblang: |
                            meta type = "created"
                            meta id = this.devicecode + "_not_fed"
                            root = {
                              "id": this.devicecode + "_not_fed",
                              "template-id": "measurement_series_not_fed_template",
                              "dbrps": [{"db": "<redacted>", "rp": "autogen"}],
                              "vars": {
                                "name": {
                                  "type": "string",
                                  "value": this.devicecode + "_not_fed"
                                },
                                "measurement": {
                                  "type": "string",
                                  "value": this.devicecode
                                },
                                "db": {
                                  "type": "string",
                                  "value": "<redacted>"
                                },
                                "rp": {
                                  "type": "string",
                                  "value": "autogen"
                                }
                              },
                              "status": "enabled"
                            }
                - log:
                    level: INFO
                    message: "Sending message to kapacitor type \"${!meta(\"type\")}\" for ${!meta(\"id\")}"
                - log:
                    level: DEBUG
                    message: "Sending message to kapacitor ${!meta(\"id\")} with body ${!json()}"
        - catch:
          - log:
              level: ERROR
              message: "Unable to creating message due to: ${!error()}. Sending original message to dlq"

    output:
      fallback:
        - switch:
            retry_until_success: false
            cases:
              - check: 'meta("grouping") == "input-stream-event" && meta("type") == "created"'
                output:
                  http_client:
                    retries: 10
                    retry_period: "10s"
                    url: "http://{{ template "alerting-system.kapacitorFullname" . }}:9092/kapacitor/v1/tasks"
                    verb: POST
                    headers:
                      Content-Type: "application/json"

              - check: 'meta("grouping") == "input-stream-event" && meta("type") == "deleted"'
                output:
                  http_client:
                    retries: 0
                    url: "http://{{ template "alerting-system.kapacitorFullname" . }}:9092/kapacitor/v1/tasks/${!meta(\"id\")}"
                    verb: DELETE
                    headers:
                      Content-Type: "application/json"

              - check: 'meta("grouping") == "input-stream-event" && meta("type") == "enabled"'
                output:
                  http_client:
                    retries: 10
                    retry_period: "5s"
                    url: "http://{{ template "alerting-system.kapacitorFullname" . }}:9092/kapacitor/v1/tasks/${!meta(\"id\")}"
                    verb: PATCH
                    headers:
                      Content-Type: "application/json"
              - check: 'meta("grouping") == "input-stream-event" && meta("type") == "disabled"'
                output:
                  http_client:
                    retries: 0
                    url: "http://{{ template "alerting-system.kapacitorFullname" . }}:9092/kapacitor/v1/tasks/${!meta(\"id\")}"
                    verb: PATCH
                    headers:
                      Content-Type: "application/json"
              - check: 'meta("grouping") == "historicization-event"'
                output:
                  kafka:
                    addresses:
                      - "central-cluster-kafka-bootstrap.<redacted>.svc.cluster.local:9092"
                    topic: "kapacitor-alerts-connector.events"
                    target_version: 2.1.0
                    key: ""
                    compression: gzip
                    static_headers: {}
                    metadata:
                      exclude_prefixes: []
                    max_in_flight: 64
              - output:
                  processors:
                    - bloblang: |
                        root = {
                          "original_message": meta("original_message"),
                          "send_message": this
                        }
                  kafka:
                    addresses:
                      - "central-cluster-kafka-bootstrap.<redacted>.svc.cluster.local:9092"
                    topic: "kapacitor-alerts-connector.dead-letters-queue"
                    target_version: 2.1.0
                    key: ""
                    compression: gzip
                    static_headers: {}
                    metadata:
                      exclude_prefixes: []
                    max_in_flight: 64

        - processors:
            - bloblang: |
                root = {
                  "original_message": meta("original_message"),
                  "send_message": this
                }
          kafka:
            addresses:
              - "central-cluster-kafka-bootstrap.<redacted>.svc.cluster.local:9092"
            topic: "kapacitor-alerts-connector.dead-letters-queue"
            target_version: 2.1.0
            key: ""
            compression: gzip
            static_headers: {}
            metadata:
              exclude_prefixes: []
            max_in_flight: 64
Configuration Considerations
Dead Letter Queue (DLQ) Strategy:
We use a DLQ for messages that fail to parse or process successfully. Messages end up in the DLQ (kapacitor-alerts-connector.dead-letters-queue) when:
- Message format doesn't match expected schema
- Kapacitor API calls fail after all retries
- Output destinations (Kafka) are unreachable
External InfluxDB Connection:
To allow the external InfluxDB instance to connect to Kapacitor deployed on OpenShift and exposed via Ingress, we set KAPACITOR_INFLUXDB_0_KAPACITOR_HOSTNAME. This tells Kapacitor what hostname to advertise to InfluxDB for subscription callbacks. Without this, InfluxDB would try to reach Kapacitor using internal Kubernetes DNS names that aren't resolvable externally.
Conclusion
This event-driven alerting architecture automated alert management for 2000+ IoT devices, replacing a manual approach that didn't scale. By leveraging the transactional outbox pattern, Debezium, Kafka, Benthos, and Kapacitor, we created a decoupled, maintainable system that:
- Automatically creates/enables/disables alerts based on device lifecycle
- Maintains consistency between configuration state and alert state
- Publishes alert events for downstream consumption
- Handles failures gracefully with dead letter queues
The key takeaway: event-driven architectures aren't just for microservices - they're equally valuable for integrating monitoring and alerting systems, especially at scale.
Useful Resources
Below are some of the main resources used. Note that the versions are not always consistent, but newer versions of the documentation often contain information applicable to older versions as well.
- Implement the outbox-pattern with Red Hat OpenShift Streams for Apache Kafka and Debezium
- Red Hat Streams for Apache Kafka 2.5 API Reference
- AMQ Streams on OpenShift Overview
- Debezium User Guide 2.7.3
- Debezium Installation Reference 3.0
- Maven Repository - Debezium
- Deploying and Managing Streams for Apache Kafka on OpenShift 2.7
- Using Kafka Connect with Plug-ins
- How to Use Debezium SMT Groovy Filter for Routing Events
- Debezium Transformations Reference 1.9
- Installing Debezium on OpenShift
- Debezium SMT Overview
This article is licensed under the CC BY-SA 4.0 license.